Analytics Platform | 2025

Uplevel

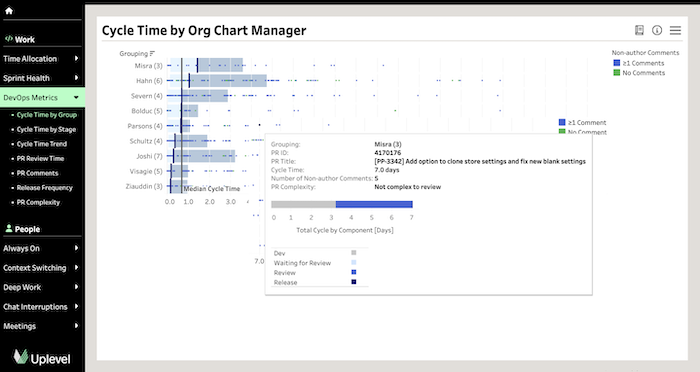
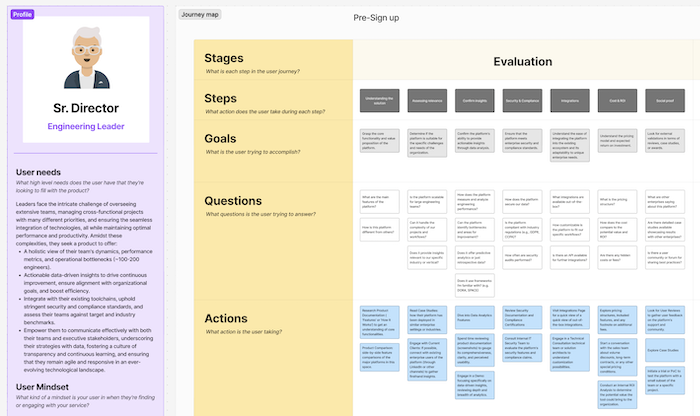
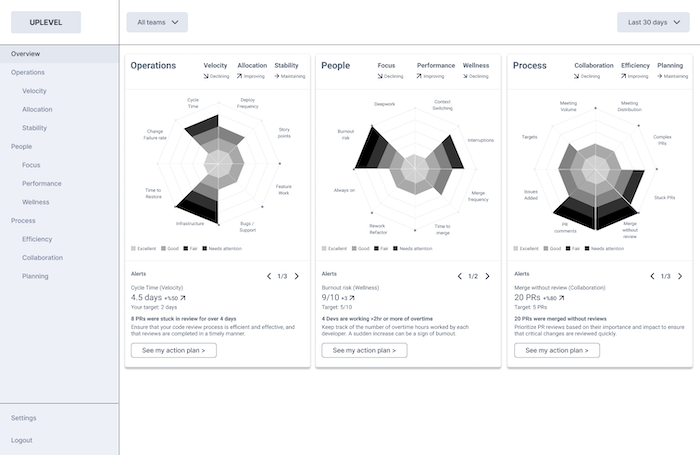
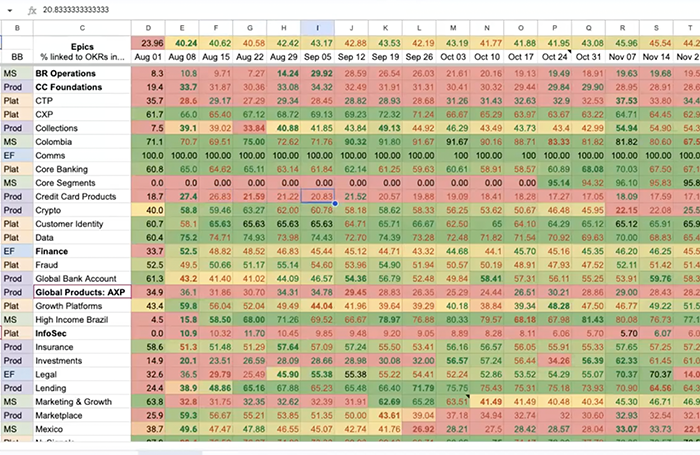
I led an end-to-end product redesign, the challenge was transforming surface-level metrics into actionable insights through intuitive data visualization and AI-driven reporting. This drove a 50% increase in engagement from our key persona, and resulted in productivity gains on the measure of 20x for their key delivery metrics.

The Challenge

Uplevel was built for engineering managers with a sprint-focused, team-level view, but its actual buyers, engineering executives, weren’t engaged. This created a disconnect between value and revenue while making it difficult to drive company-wide alignment on key metrics and initiatives.

Legacy Experience

When I started, Uplevel was leveraging Tableau to create custom reports for executives to get them the insights they needed, which were not available in the product. This had the downside of being very expensive in terms of cost for licensing and the personnel overhead to create each custom report, while also heavily focused on renewals, and not a big attractor for potential new customers.

Design Sprint

I facilitate a series of design sprints to align C-suite, product, and engineering leads to align everyone around a better understanding our key buyer persona, iterating on designs for a new unified experience, and testing our assumptions regarding the needs of engineering executives and their orgs.

Early Prototypes

I conducted multiple rounds of user testing followed by design iteration that revealed a desire for executives to have a single pane of glass from which to manage their org performance. Early iterations sought to abstract key metrics into high level scores and suggestions, but that proved too challenging for comprehension and taking action. Later iterations moved more towards showing trends over time rather than single point metrics, alerting on a deviations from goals or benchmarks, and providing more context for the value of each metric.

Key Findings

I conducted user interviews with engineering executives to understand their long-term workflows and decision-making challenges. Despite having access to vast amounts of data, they relied on manual reports, spreadsheets, and intuition to make sense of it, highlighting the need for a centralized, actionable source of truth to drive alignment and efficiency.

Measuring Success

The new experience saw higher initial engagement than the legacy system but lacked the lasting impact users needed. To address this, I implemented success metrics that tracked the cadence of executive vs. manager engagement, creation of custom segments and targets, and the breadth and depth of engagement across product pages. This revealed that users wanted more actionable guidance on where to focus, how to improve their organizations, and what concrete steps they needed to take next.

Creating a framework

I worked closely with our Account Executive, Sales, Support, and Data Science teams to create a framework for users to think about our metrics in a more outcome-oriented way. The goal was to align our value delivery outcomes and find ways to innovate on the notion of productivity with our unique metrics (e.g. Deep Work, Always On, and other proprietary correlations). We developed the WAVE framework as a way to not only explain our approach to organizational improvement and maturity, but also to create an internal set of correlated metrics to show in the product experience.

Final Design

The final experience included more flexibility regarding pivots on our metrics in order to provide leaders with the necessary customization they sought, given the vast complexity of organizational differences and needs uncovered during the course of my research. To help our product stand out in the market, I focused the experience more on unique metrics like focus, velocity efficiency, and breakdowns of contributor efforts on key investment project. The aim was to provide a high enough view of the organization for executives, while still supporting managers in their need to explore the data in depth and enact change from within their teams.

View Full Case Study

More work